
This project entailed data collection and graphic visualization of that data. The topic portrays the amount of food-related waste that is thrown away compared to any other type of trash.

Final Poster Design

My data collection sheet that provided the information for the visuals
This was a thorough process of research and revisions. I started by inputting my data into RAWGRAPHs. From there I played with different possible solutions, my first choice out of these experiments was actually this bubble graph:

Which was then modified into the following:
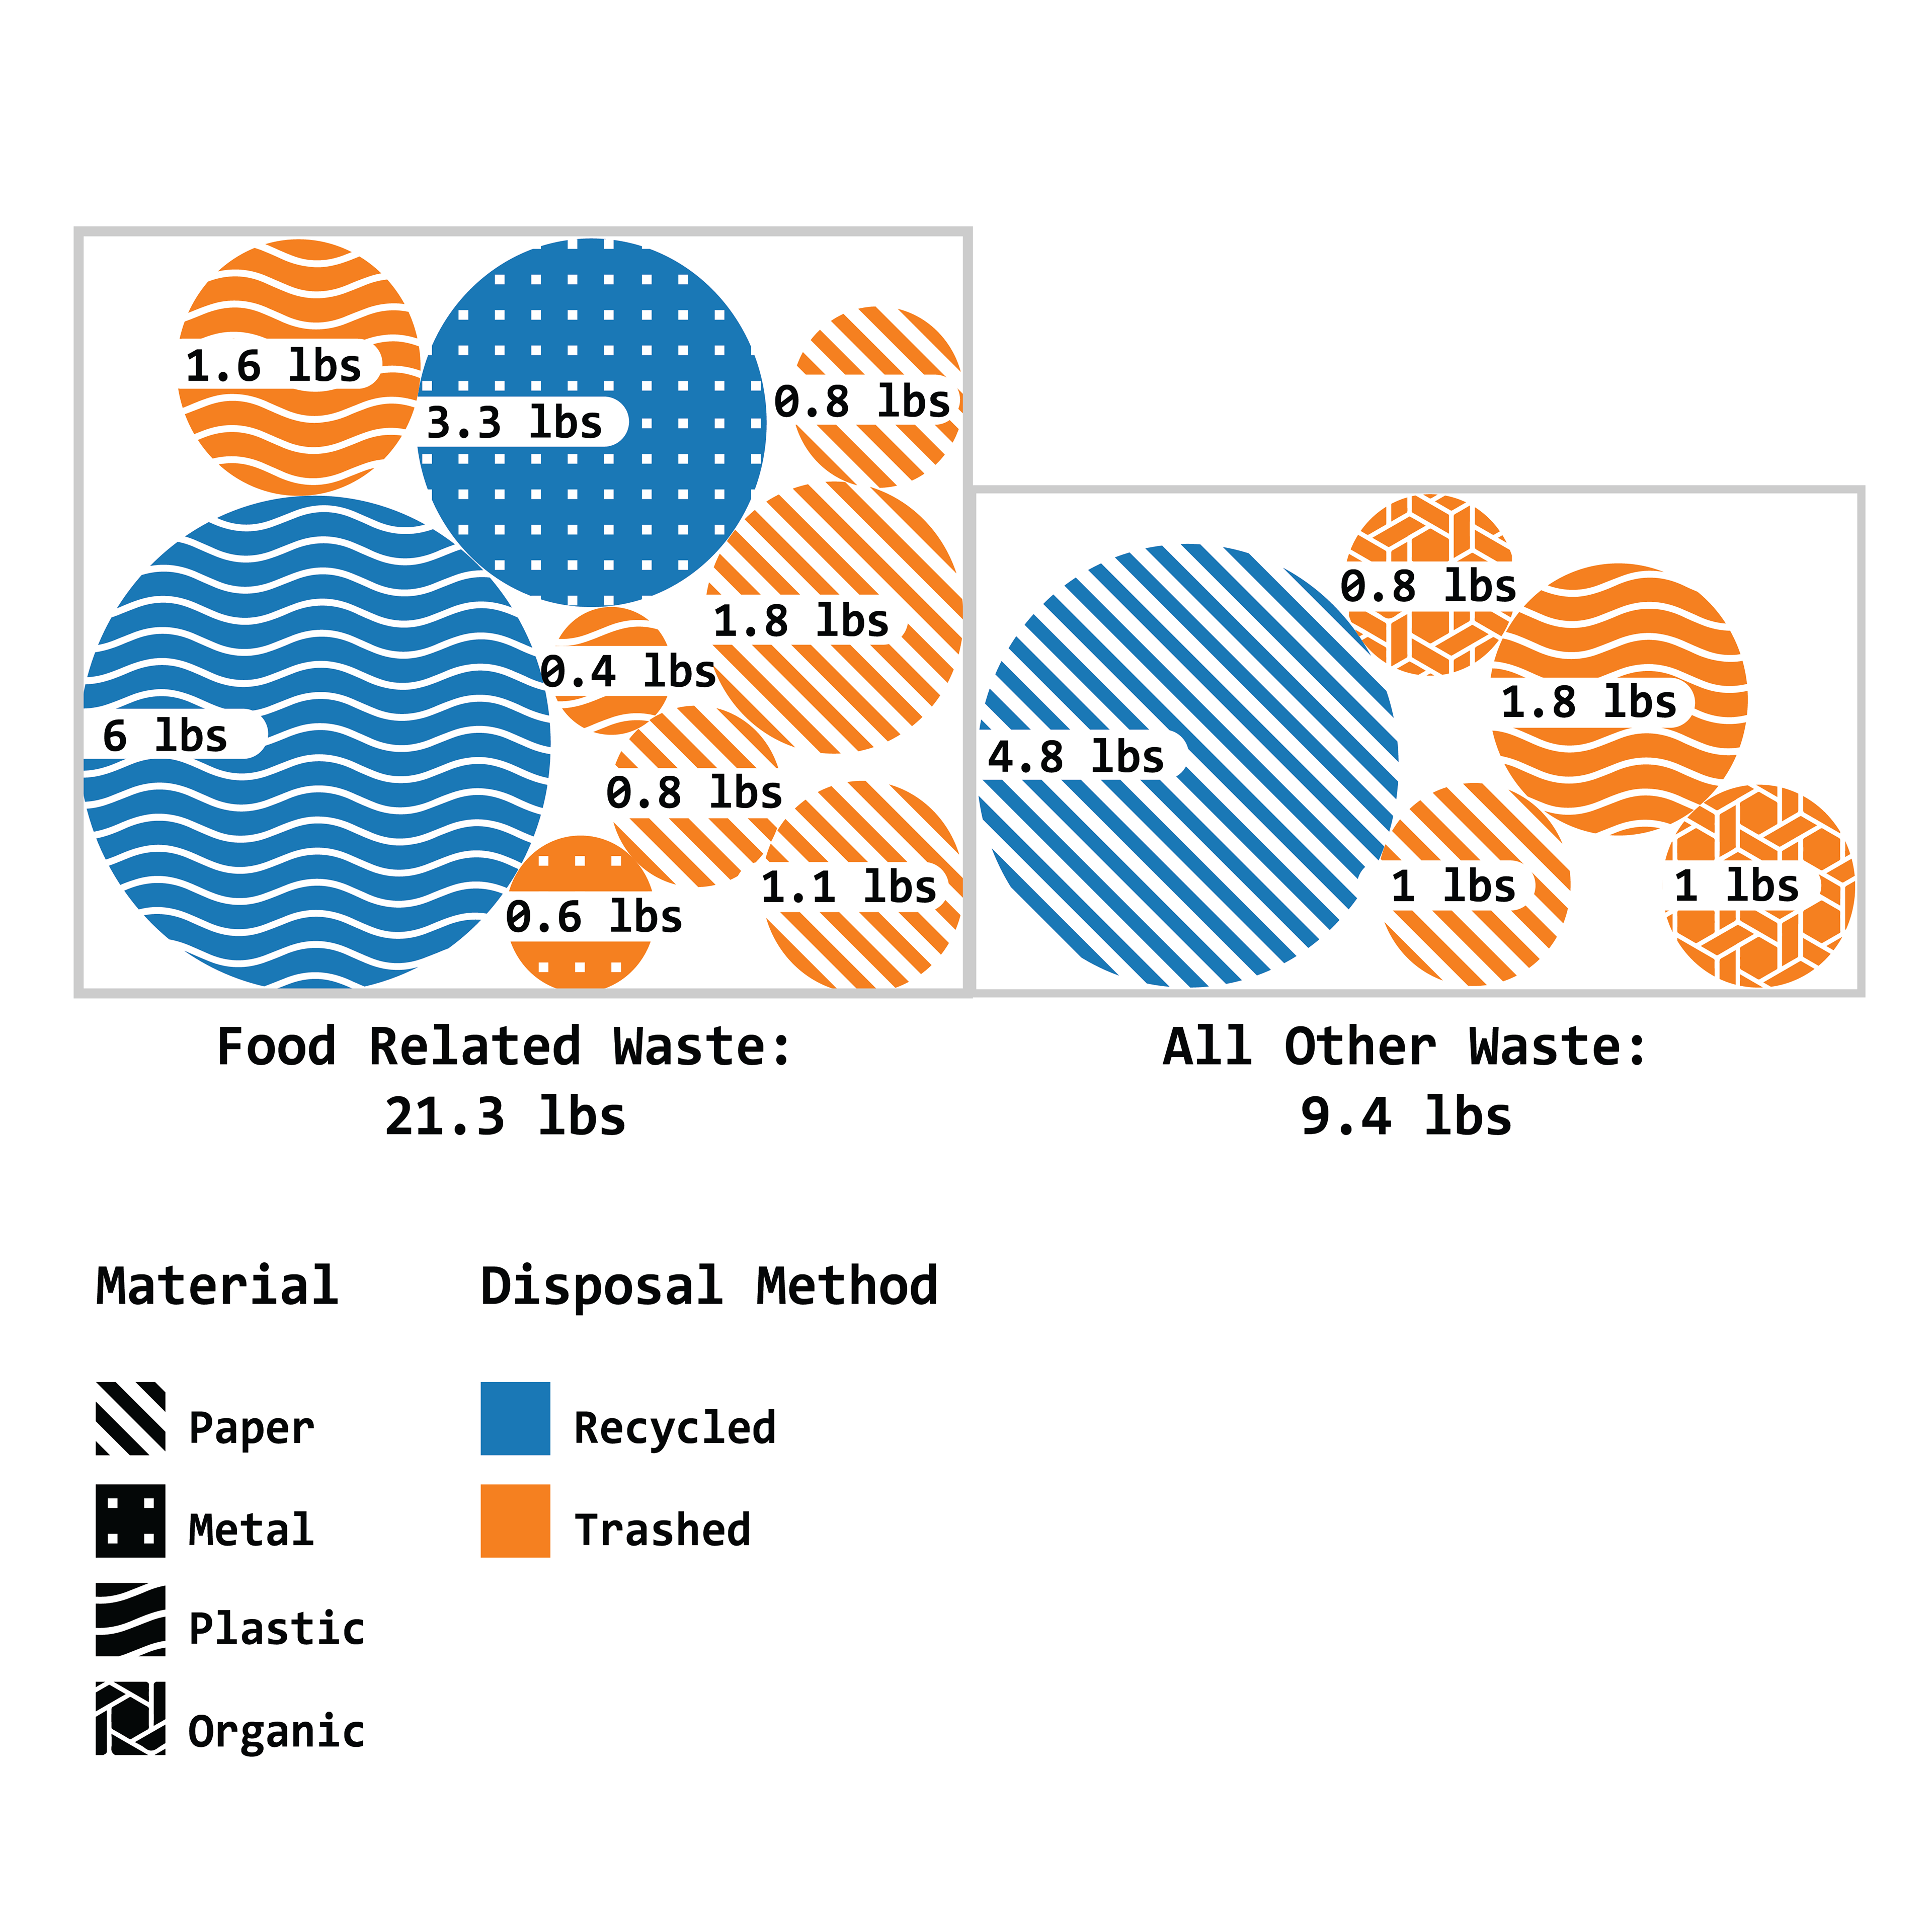
This draft was inspiring for future revisions, however it didn't quite meet the criteria for success that the final outcome should have, so I took it back to RAWGRAPH to start a much different approach.
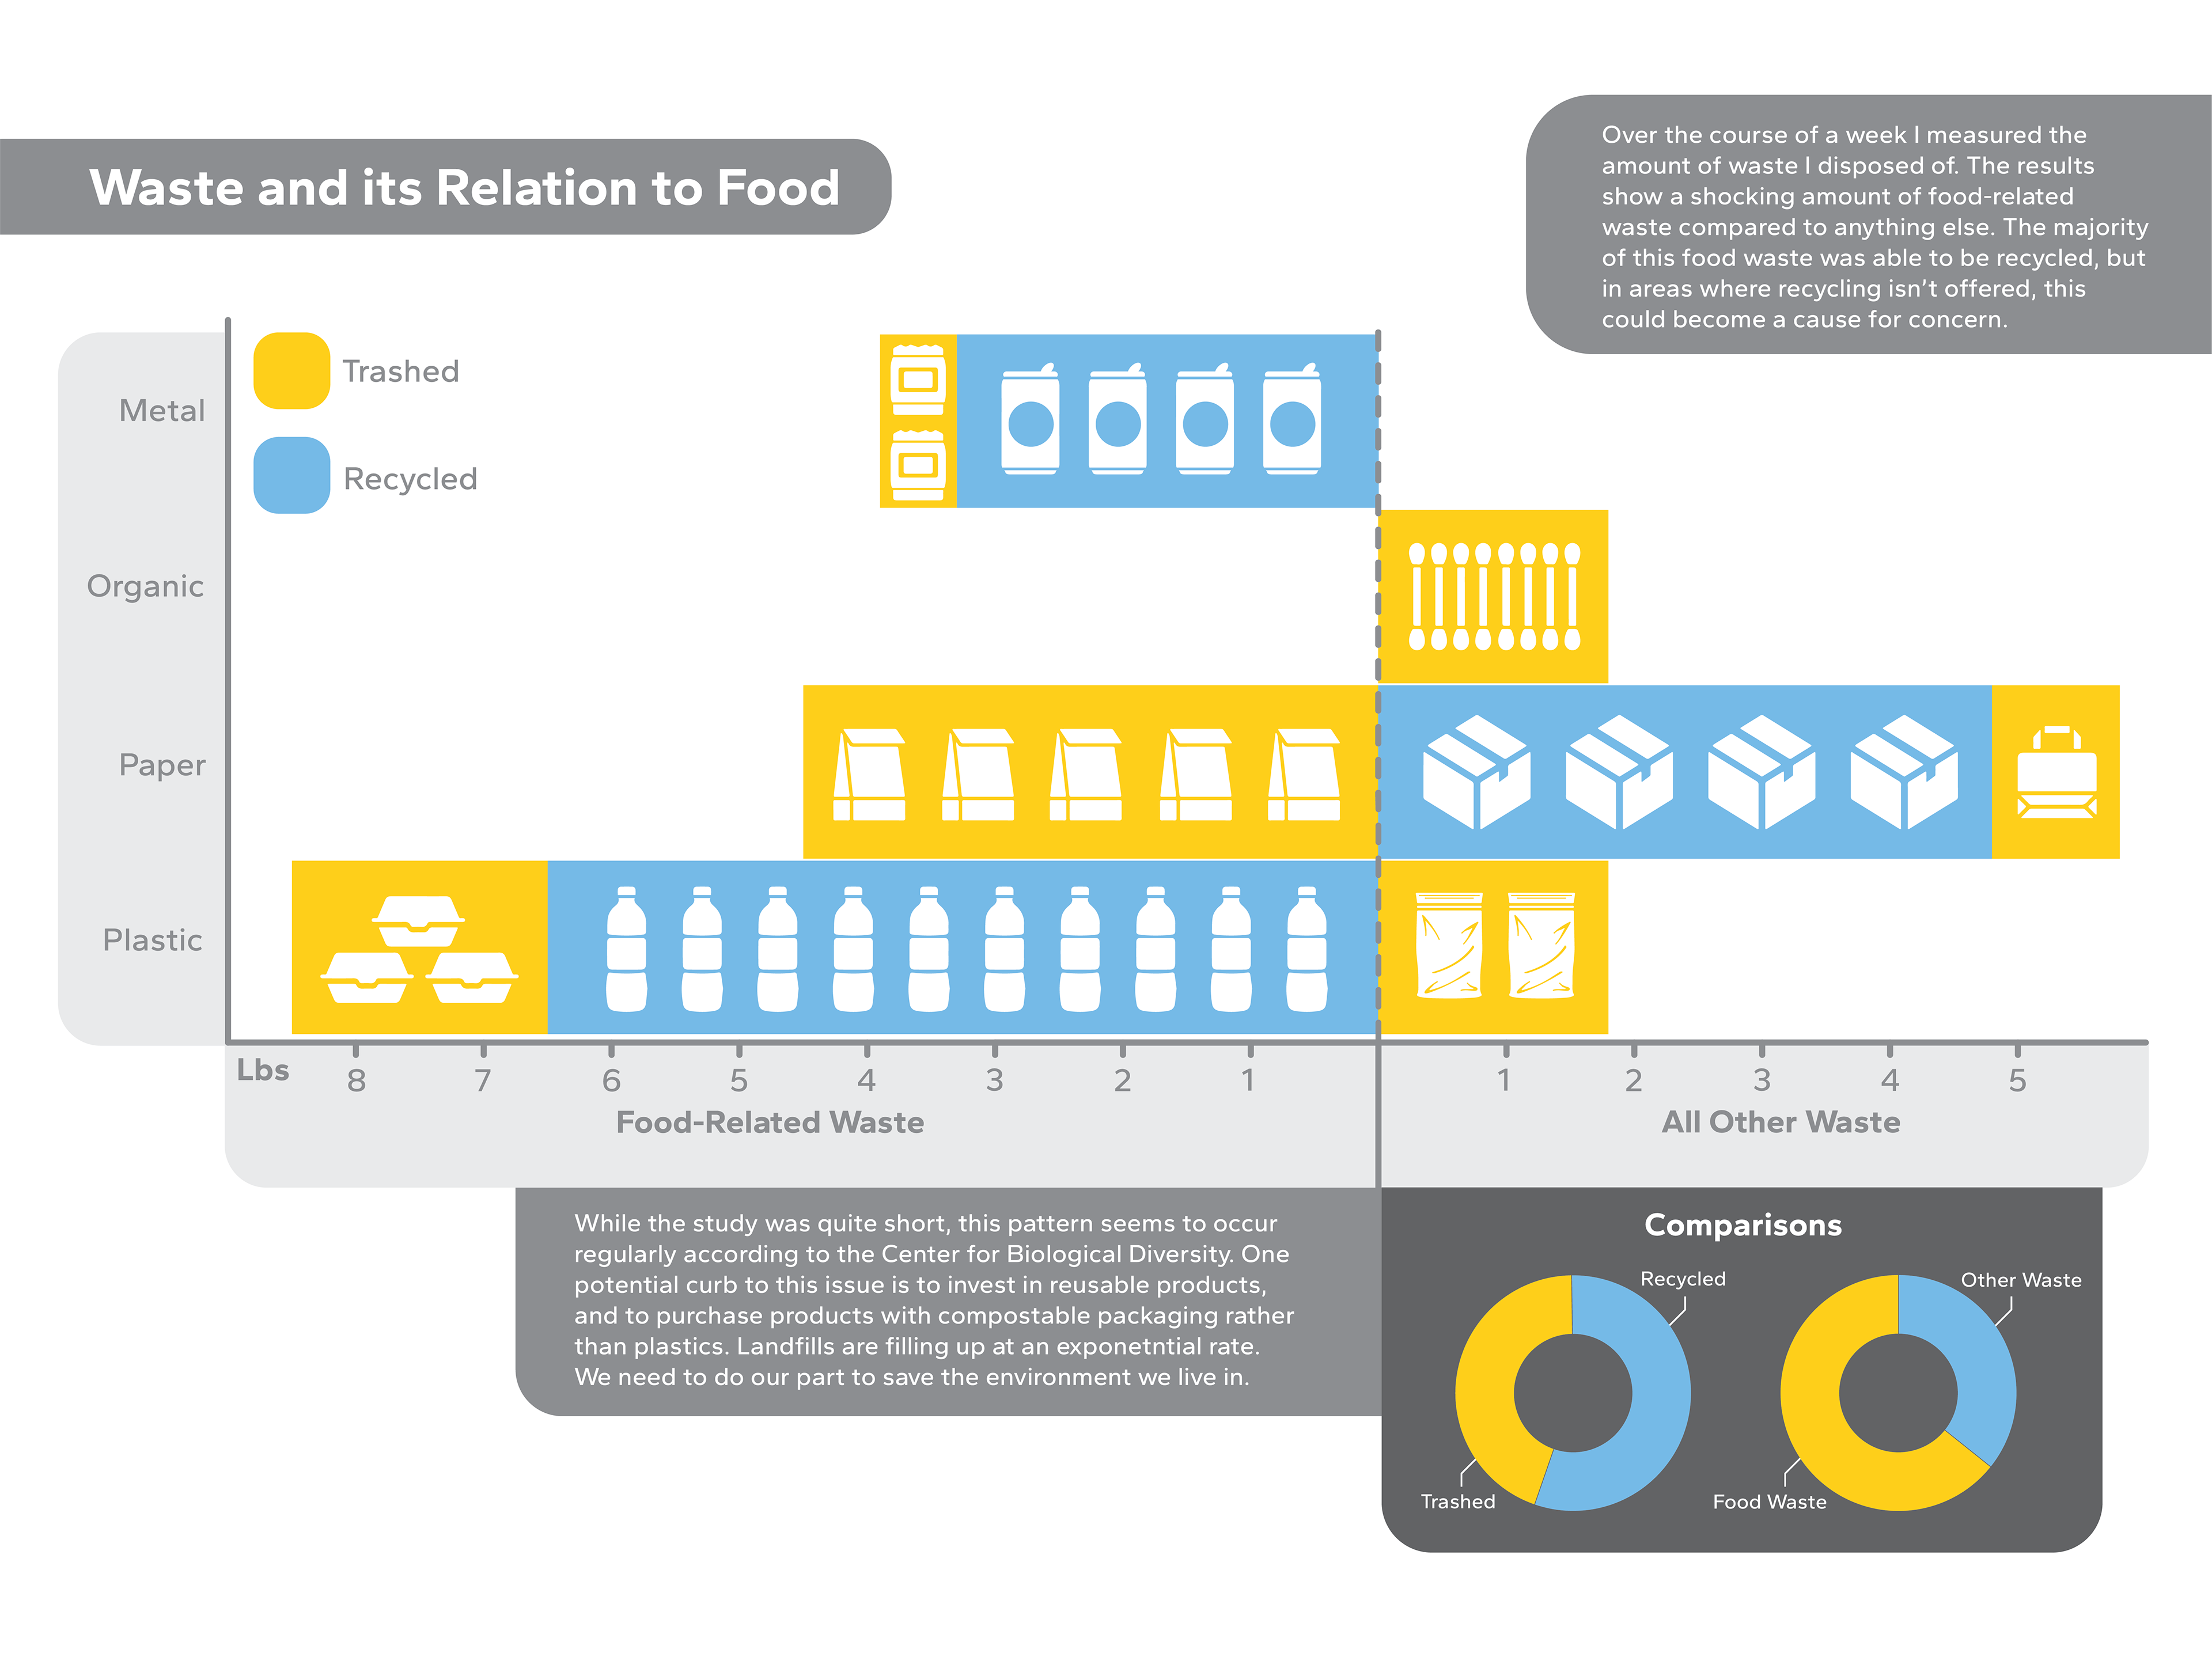
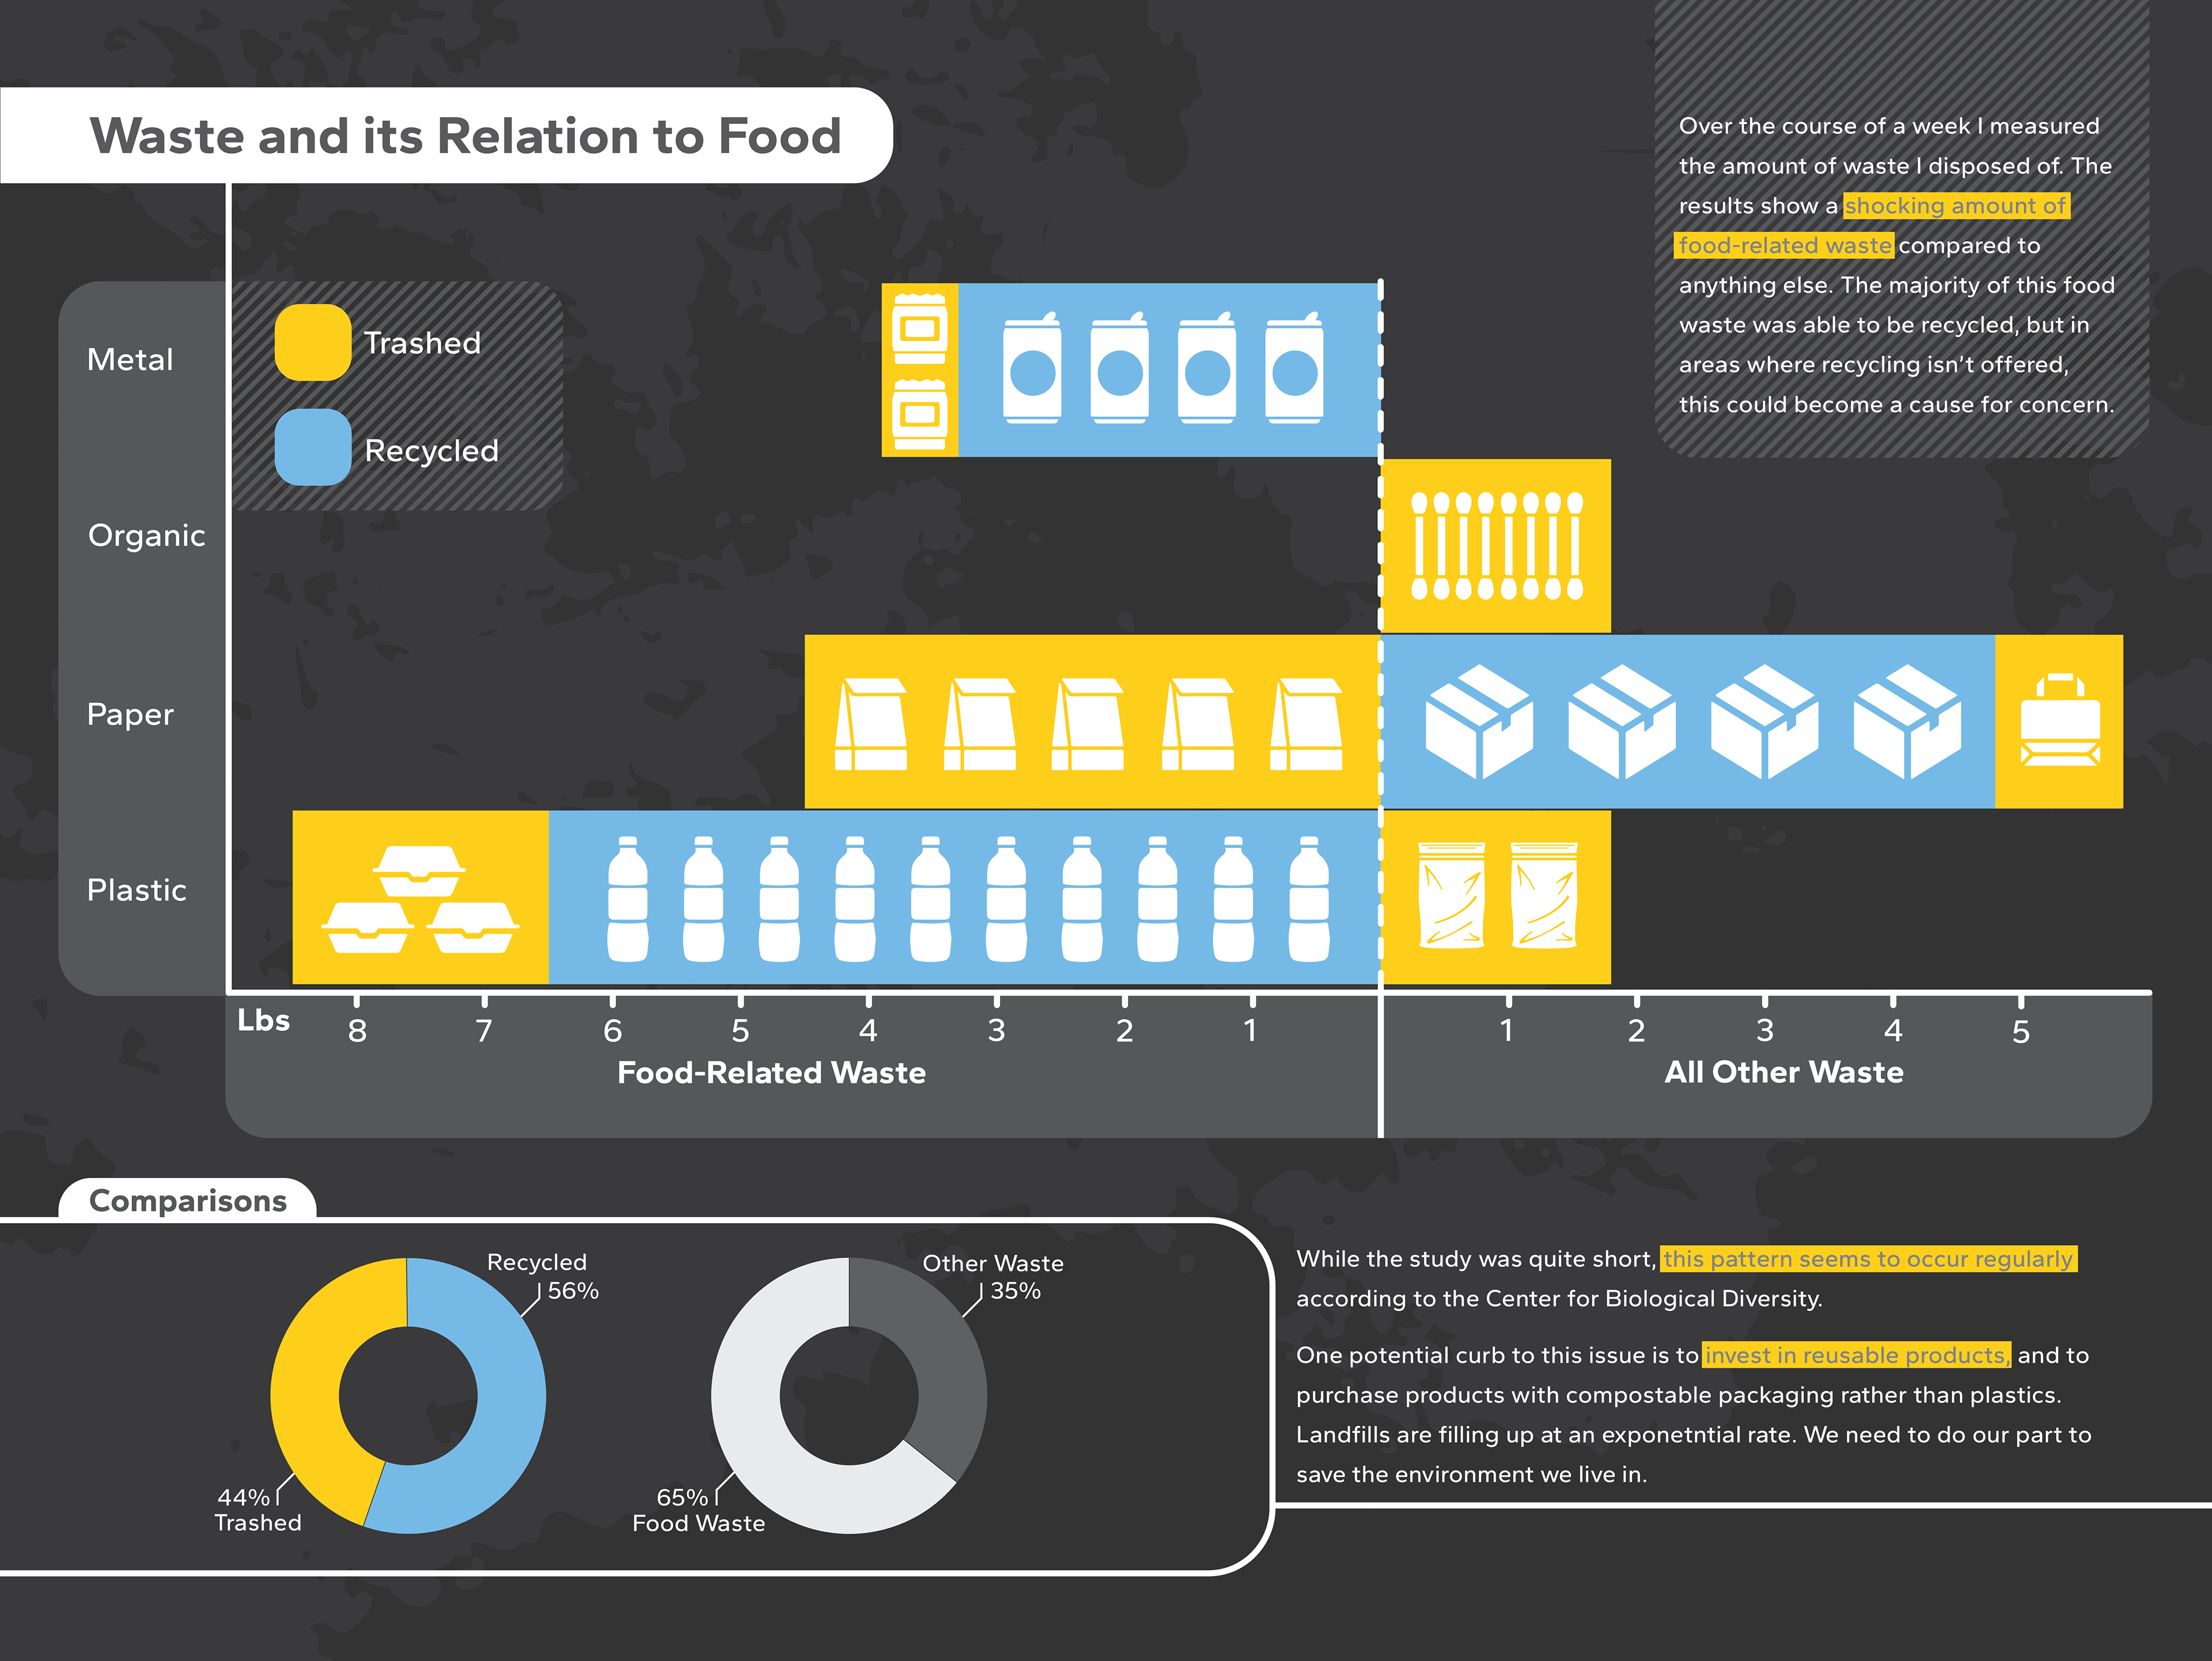
As my final draft, a lot more went into this. Pictograms were brought up and added, the data was cleaned up as to be more legible, and the overall form changed from those previous bubble graphs to a sort of split bar chart. This approach was what the data needed to fully detail the point I was trying to get across. I did some extra research for my copy and learned that my findings weren't in isolation. This was a repeated trend, and that message is reciprocated through the paragraphs in the composition. The rest of the revisions from this point on were simple layout changes and aesthetic improvements to make the poster more appealing to the eye.
And that is how I ended up here with this final piece. I believe it carries its message quite clearly and thoroughly explains the data in a visual manner. This was a much different workflow than I was previously used to, but it helped me learn a lot of skills that I really hadn't even thought about prior to this project.
What?
I logged anything I threw away or recycled. The consequences of the high waste output of the US is the rapid expansion of landfills and pollution of the environment.
So what?
The chart describes how much I disposed of during a week. The lopsidedness towards food related waste is reflected in national data. This is a trend that is making pollution much worse and should be focused on to help save our environment.
Now what?
Unless we as a nation take action to try and reduce our trash output, major ecological consequences could happen. Many landfills are closed today because they've filled up. These are acres of land around our country that are now unusable piles of garbage. Unless we want to start constructing our homes in dumps, preemptive action needs to be taken to tackle this issue.